Python Codings
一些python的经验
general通用技巧
batch run skills 批量运行小技巧
pass argues from command line 预留命令行接口
import sys
import getopt

def myfunc(argv):
    arg_input = ""
    arg_output = ""
    arg_user = ""
    arg_help = "{0} -i <input> -u <user> -o <output>".format(argv[0])

    try:
        opts, args = getopt.getopt(argv[1:], "hi:u:o:", ["help", "input=",
        "user=", "output="])
    except:
        print(arg_help)
        sys.exit(2)

    for opt, arg in opts:
        if opt in ("-h", "--help"):
            print(arg_help)  # print the help message
            sys.exit(2)
        elif opt in ("-i", "--input"):
            arg_input = arg
        elif opt in ("-u", "--user"):
            arg_user = arg
        elif opt in ("-o", "--output"):
            arg_output = arg

    print('input:', arg_input)
    print('user:', arg_user)
    print('output:', arg_output)

if __name__ == "__main__":
    myfunc(sys.argv)
Ref: {Link}
*args, **kwargs
{参考简书}
*args wrap the input as tuple.
**kwargswrap them as a dict
kwargs and args are just conventional, like self in class definition.
@ 语法糖 — 单行代码利器
【python语法糖与Aspect-oriented Programming-知乎】
My understanding now:
@a
@b
@c
def f ():
Equals to:
f = a(b(c(f)))
glob — 批量文件处理
glob是python自带文件处理器,载入:
import glob
glob.glob可以快速查找文件,返回单个值
glob.iglob返回文件迭代器,批量处理文件时节省内存(推荐)
【python中glob的用途-CSDN】
绘图matplotlib
Legends setting when there are more than one subplot.
Use figure legend
Plt legend in figure and transform it into ax
Reference: https://www.cnblogs.com/Atanisi/p/8530693.html
With sample code shown below:
fig.legend(bbox_to_anchor=(1,0), bbox_transform=ax.transAxes)
The introduction of bbox:
Also very useful in-subplots 内部局部放大图教程
https://blog.csdn.net/weixin_30898555/article/details/112699536

- bbox_to_anchor:边界框,四元数组(x0, y0, width, height)
- bbox_transform:从父坐标系到子坐标系的几何映射

My work
def UCS_plot(df):
    fig, ax = plt.subplots(figsize=(8,6))
    line = ax.plot(df['UCS'].values,'k-',lw=2,label='UCS')
    ax1 = ax.twinx()
    bars = ax1.bar(x=np.arange(df.shape[0]), height=df['Wear'].values,
                   color='r',alpha=0.6, label='Cutter Wear')
    ax.set_ylabel('UCS(MPa)')
    ax1.set_ylabel('Wear(mm)')
    fig.legend(loc='upper left', bbox_to_anchor=(0,1), bbox_transform=ax.transAxes)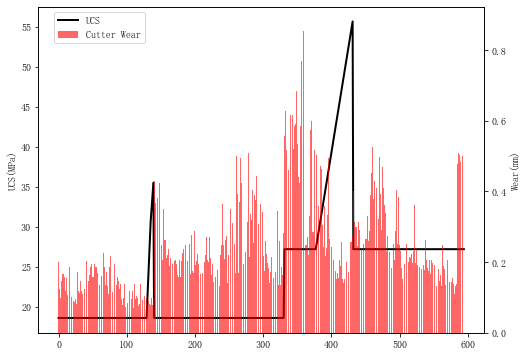
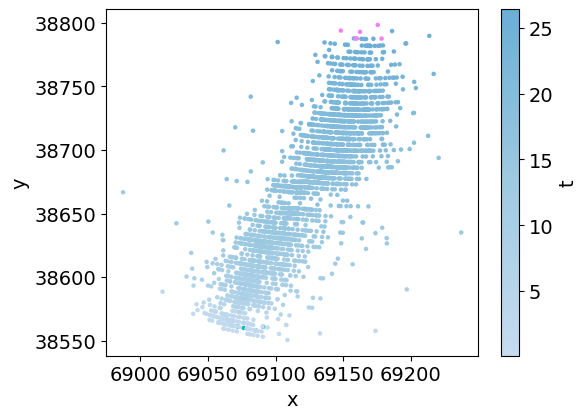
Customized colorbar
Matplotlib provide official colorbar scaling {Link}, but it does not support pandas usage, such as
df.plot(..., cmap=new_cmap). But this stackoverflow post {link} provides a reference for this, where I summarized it into the following code.
import matplotlib as mpl
cmap = mpl.cm.Blues
new_cmap = mpl.colors.LinearSegmentedColormap.from_list(
        'new_cmap',
        cmap(np.linspace(0.5, 1, 50)))
new_cmap.set_under('c')
new_cmap.set_over('violet')
Note that the
set_underand
set_overneed to be used with
vminand
vmaxwhen plotting. An example is shown below. Note the initial step is cyan, and last step is violet, with gradient transition in steps between.
pandas & numpy 数据处理
Powerful combo of pandas
manipulating data with mapping funcitons: apply, lambda, if
In previous post, difference between map, apply, applymap has been explained.
‘df.mode()‘ may return a dataframe, because it may have multiple modes for a series. A typical solution is ‘df.fillna(df.mode()[0])’
‘df.apply()‘ works for function operations on certain row or column
DataSci&MachLearn Workflow 1/4
‘df.applymap()’ works for function operations on whole dataframe
‘df.map()‘works for dictionary replacement
‘df.groupby()’ is also commonly used with these functions for quick feature selections.
In a brief:{Ref-Zhihu}
- For series we have map()
map() and applymap() is more suitable for simple function with one input or a mapping dictionary. Usually applied with ‘lambda’ - apply() works for more complex functions and take multiple input with apply(func, args=(x,))
But here with combination of apply and lambda&if, we will put the productivity of pandas into a whole new level. Check out these examples:
Eg.1. Data selection
data = pd.DataFrame({'A':[1,2,3,4],"B":[4,5,6,7],'C':[7,8,9,3]})
data['D']=data['C'].apply(lambda x: x+7 if x<5 else x)
data
Output:

Eg.2. Info withdraw
import pandas as pd

d = {"col1" : ["96%(1368608/1412722)",
"97%(1389916/1427922)",
"97%(1338695/1373803)",
"96%(1691941/1745196)",
"95%(1878802/1971608)",
"97%(944218/968845)",
"96%(1294939/1336576)"]}
df1 = pd.DataFrame(d)

# load the digits from "(" to "/"
df1['正确数'] = df1.iloc[:,0].apply(lambda x : x[x.index('(') + 1 : x.index('/')])
df1['总数'] = df1.iloc[:,0].apply(lambda x : x[x.index('/') + 1 : -1])
df1['正确率'] = df1.iloc[:,0].apply(lambda x : x[:x.index('(')])
df1

#cited from: https://blog.csdn.net/mochou111/article/details/95311065
Slicing
IndexSlice读取 比.loc[]的返回值更加规范
<pre class="wp-block-code">idx = pd.IndexSlice idx['a','b','c'] # 如果某级全部读取则采用 :
Ref
简书多重索引高阶用法
https://www.jianshu.com/p/760cd4f46c8d
检查多层索引
先转换为dataframe后再利用dataframe的功能进一步查询。
<pre class="wp-block-code">`
idx_df = info.index.to_frame()
MultiIndex dataframe
# 读取方式
df3.loc[('S30',3)].head()
通过.loc[]读取,.loc是优先使用label进行定位的,可以类似坐标索引实现多层下的寻找
读取行名
df1._stat_axis.values
读取不重复的元素
# Unordered
set(list)

# Ordered
{}.fromkeys().keys() # create a dict with unique keys only

For more, see the reference:
https://www.jb51.net/article/62587.htm
随机抽取
import random

# return a value, unable to set weights
random.choice(list)

# return a list without repeated values
random.sample(list, n_sample)

# run multiple times random with weights
# multiple but possibly repeated values return
a = {张三: 0, 李四:1, 王五:0, 赵七: 0, 钱八: 0}
random.choices(list(a.keys()), weights=list(a.values()), k=5)

>>>['李四', '李四', '李四', '李四', '李四']
重新生成索引
主要用于调整df的行/列空间数据,reindex中传入新的名称会对应修改行/列空间数据,比较适合快速调整df的数据或自动生成。如果只是修改个别索引的名称,建议实用df.rename()
https://vimsky.com/examples/usage/python-pandas-dataframe-reindex.html
df.rename() 重命名
mapper or dictionary can also be transferred to df.rename() function. Only index will be change without effect on data.
df.rename(index={'A':1}, level=2}
# change all 'A's in index into 1 in level 3 (for MultiIndex)

RES_DF = res_df.drop(index=('train','2-V-R',5), inplace=False)
RES_DF.rename(index={6:5}, level=2, inplace=True)
利用数据对应ID,浅析python pandas数据类型 DataFrame的 copy和= 操作的异同
df2 = df1.copy() create new object with new id df2 = df1 only create new object but the same id, and both won't transfer the operation on df2 to df1.
df2 = df1.copy(deep=True) will bind df2 and df1 on operation as well.
df2 = df1.copy() create new object with new id df2 = df1 only create new object but the same id, and both won't transfer the operation on df2 to df1.
df2 = df1.copy(deep=True) will bind df2 and df1 on operation as well.
In[33]: import pandas as pd
In[34]: df1 = pd.DataFrame([1,2,3,4,5])
In[35]: id(df1)
Out[35]: 4541269200

In[36]: df2 = df1
In[37]: id(df2)
Out[37]: 4541269200  # Same id as df1

In[38]: df3 = df1.copy()
In[39]: id(df3)
Out[39]: 4541269584  # New object, new id.

In[40]: df4 = df1.copy(deep=False)
In[41]: id(df4)
Out[41]: 4541269072  # New object, new id.

In[42]: df1 = pd.DataFrame([9, 9, 9])
In[43]: id(df1)
Out[43]: 4541271120  # New object created and bound to name 'df1'.

In[44]: id(df2)
Out[44]: 4541269200  # Old object's id not impacted.

In[10]: arr1 = [1, 2, 3]
In[11]: arr2 = [1, 2, 3, 4]
In[12]: df1 = pd.DataFrame([[arr1], [arr2]], columns=['A'])
In[13]: df1.applymap(id)
Out[13]:
            A
0  4515714832
1  4515734952

In[14]: df2 = df1.copy(deep=True)
In[15]: df2.applymap(id)
Out[15]:
            A
0  4515714832
1  4515734952
'is' vs '=='
isreturn 'True' is the two item has identical ID and value.
==return 'True' when they have the same value.
miscellaneous
dataframe似乎有个b = a.group_by有点意思