Statistics miscellaneous
Temporary uncategorized statistic jargons, tricks, and memes.
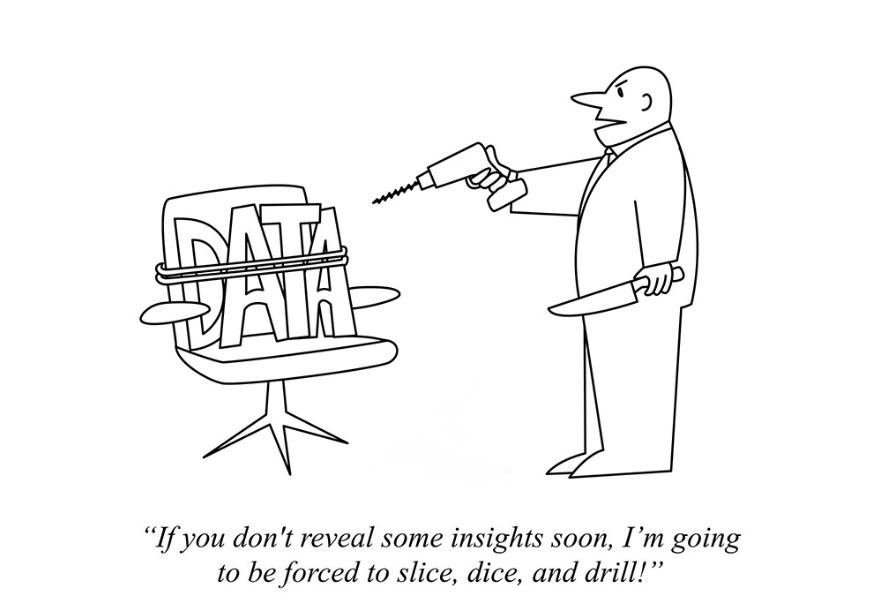
p(-value) hacking
Also called data dredging, data fishing. Manipulate the data to convince audience some statistically.
P-value indicates the probability of the current value occurs in the given distribution. Usually p<0.05 implies the sampling/hypothesis is biased and unacceptable.

Semi-Variogram: Nugget, Range and Sill
[Ref] Semi-variogram is 1/2 squared difference between all data pairs over spatial distance. It originates in Geographic Information System illustrating relationship between data correlation versus spatial distance.
{Ref} says the intercept at 0 distance is Nugget, standing for microscopic uncertainty beyond measurement details limit. And Sill is

Likelihood
A reversed version of probability to evaluate the chance an hypothesis is acceptable.
This example from U of McGill is illustrative.
http://www.medicine.mcgill.ca/epidemiology/hanley/bios601/Likelihood/Likelihood.pdf
Variability estimation
PEM (probability estimation method)
rosenblueth method, seems like a type of bootstrapping method. Rocscience Phase2.0 implementation: PDF
Stochastic process
This is a good ebook resource to start. {Link}