主要参数
plt.pie(
    x, # 各扇形的数值
    explode=None, # 爆炸分离显示与否,通过bool array指定
    labels=None, # 显示的标签
    colors=None,
    autopct=None, # 自动计算百分比并按格式显示,例如'%.2f%%'时显示为23.45%
    pctdistance=0.6,
    shadow=False,
    labeldistance=1.1,
    startangle=0,
    radius=1,
    counterclock=True, # 数据放置默认按逆时针
    wedgeprops=None, # 扇形参数
    textprops=None, # 可以通过dict传入字体设置参数
    center=(0, 0),
    frame=False,
    rotatelabels=False,
    *,
    normalize=None,
    data=None,
)
设置填充(用于科研绘图)
这里利用的主要时pyplot的实例化思想,单独修改某个参数。
# 内置的填充种类
patterns = ('/','//','-', '+', 'x', '\\', '\\\\', '*', 'o', 'O', '.')

ax.cla()
fig_nested_pie, ax = plt.subplots(figsize=(16,8))

size = 0.3
FS = 14
PD = 0.85
cmap = plt.get_cmap('tab20')
outer_colors = cmap(np.arange(4)*2)
inner_colors = cmap(np.arange(4)*2+1)
wedge_dic = dict(width=size,edgecolor='w')
font_dic = dict(fontsize=FS,weight='bold')

wedges_num,texts_num,autotexts_num = ax.pie(x=list(sec_counts.values()),autopct='%.2f%%',shadow=False,
                       colors=inner_colors,textprops=font_dic,wedgeprops=wedge_dic,pctdistance=PD,radius=1-size)

# 此处利用了ax.pie返回的第一个参数是wedges的特点
wedges_loss,texts_loss,autotexts_loss =  ax.pie(x=list(loss_counts.values()),radius=1,autopct='%.2f%%',shadow=False,textprops=font_dic,colors=outer_colors,wedgeprops=wedge_dic,pctdistance=PD)

lgd_num = ax.legend(handles=wedges_num,labels=sec_counts.keys(),title='Num Counts',loc='lower right',fontsize='x-large')

ax.add_artist(lgd_num) # 添加到画布,实现一图双legend

ax.legend(handles=wedges_loss,labels=loss_counts.keys(),title='Loss Counts',loc='upper right',fontsize='x-large')
此时的效果
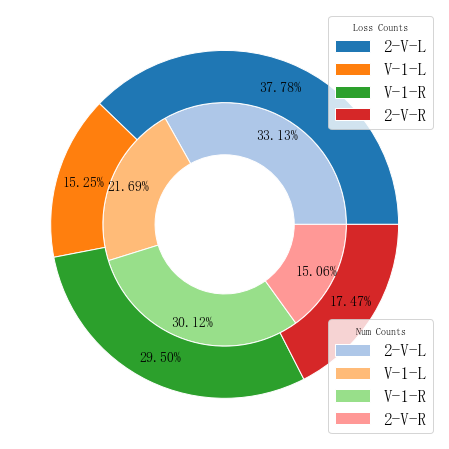
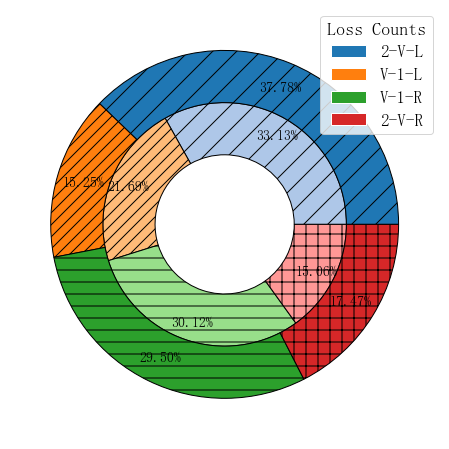
还可以进一步设置图像填充
# 面向对象的设置填充
hatches=['/','//','-', '+']

for wedge,hatch in zip(wedges_num,hatches):
    wedge.set_hatch(hatch)

# 设置边界颜色
for wedge in wedges_num:
    wedge.set_edgecoler('k')

# 设置legend title大小
egend.get_title().set_fontsize(fontsize=18)

# 移除多于的legend
ax.artists.clear()
效果图
图例legend设置
legend(loc  # Location code string, or tuple (see below).
            #  图例所有figure位置。  labels  # 标签名称。
    prop    # the font property.
            #  字体参数
    fontsize  # the font size (used only if prop is not specified).
              #  字号大小。
    markerscale  # the relative size of legend markers vs.
                 # original  图例标记与原始标记的相对大小
    markerfirst  # If True (default), marker is to left of the label.
                 #  如果为True,则图例标记位于图例标签的左侧
    numpoints  # the number of points in the legend for line.
               #  为线条图图例条目创建的标记点数
    scatterpoints  # the number of points in the legend for scatter plot.
                  #  为散点图图例条目创建的标记点数
    scatteryoffsets    # a list of yoffsets for scatter symbols in legend.
                    #  为散点图图例条目创建的标记的垂直偏移量
    frameon    # If True, draw the legend on a patch (frame).
               #  控制是否应在图例周围绘制框架
    fancybox    # If True, draw the frame with a round fancybox.
                #  控制是否应在构成图例背景的FancyBboxPatch周围启用圆边
    shadow    # If True, draw a shadow behind legend.
                #  控制是否在图例后面画一个阴影
    framealpha  # Transparency of the frame.
                #  控制图例框架的 Alpha 透明度
    edgecolor    # Frame edgecolor.
    facecolor    # Frame facecolor.
    ncol    # number of columns.
            #  设置图例分为n列展示
    borderpad    # the fractional whitespace inside the legend border.
                # 图例边框的内边距
    labelspacing    # the vertical space between the legend entries.
                  #  图例条目之间的垂直间距
    handlelength    # the length of the legend handles.
                  #   图例句柄的长度
    handleheight    # the height of the legend handles.
                  #   图例句柄的高度
    handletextpad    # the pad between the legend handle and text.
                    #   图例句柄和文本之间的间距
    borderaxespad    # the pad between the axes and legend border.
                    #  轴与图例边框之间的距离
    columnspacing    # the spacing between columns.
                    #  列间距
    title    # the legend title.
             #  图例标题
    bbox_to_anchor    # the bbox that the legend will be anchored.
                    #  指定图例在轴的位置
    bbox_transform)    # the transform for the bbox.
                    # transAxes if None.
tips:
个人推荐输出纯色填充图像后再用AI修改,更加直观快捷。
Official Docs
https://matplotlib.org/stable/api/_as_gen/matplotlib.pyplot.pie.html